
The Case For Selling Sooner Rather Than Later
November 24, 2015 | Randy Reis, ReisNYC
When it comes to real estate pricing in the city — and though the charts below are created from Manhattan data, Manhattan is representative for the city on a whole — there are quite a few clouds gathering on the horizon, and one might even say that you can hear thunder. Let’s go down the list of the warning signs.
Sales Slowing
First off there is the ultra-lux market. Ultra-lux is defined as properties over $10 million. That market has basically come to a standstill. There are very few properties changing hands as the buyer pool capable of purchasing these properties has apparently had their appetites satiated. (The Real Deal) In fact, the unheard of has happened: a buyer at One57 — possibly the most expensive building ever built and sold — has decided to take a loss of $2 million on his condo. This is in a building on “Billionaires Row,” where prices were supposed to climb higher than the buildings themselves. They have stopped climbing. (The Real Deal)
The slowdown has also spread to the luxury market — properties selling for $3–$10 million. Approximately 650 New York City listings lowered their asking price by at least 5 percent over the last 30 days, compared to 419 listings in the previous 30-day period, according to StreetEasy. And only 29 of those homes were priced at $10 million and up. (The Real Deal) To further highlight the sales slowdown, many owners unable to sell their luxury property have taken to listing those units for rent. This has created a situation that seems almost absurd: there are more Manhattan apartments available for rent priced above $15,000 per month than there are priced below $2,000 per month. That is $180,000 per year in after-tax dollars. (Curbed NY)
And even Brooklyn — the darling of the hipster/family set — has not been immune from a little bit of worry. (StreetEasy)
The Coming Deluge
Michael Stoler has been interviewing the top real estate people in NYC for as long as I have been interested in property — longer than I would like to admit. This past month he had guests on from the New Development segment of the business. The main takeaway: because of regulatory issues like tax abatements expiring, the number of units coming to market in 2016 will be the highest in history. The number bandied about, for all of NYC, was 60,000. That’s not a typo — 60,000 new units coming available for sale in 2016. If anyone thinks that will not put a damper on rising prices, I have a bridge for sale. (View the interview here)
Interest Rates
The end of falling interest rates has been predicted for too long by too many people for it to warrant going into deeply, so I will only touch on it. Interest rates WILL at some point end the current cycle (which has been in effect for almost 35 years, since 1981). When they do, they will likely rise further and for a longer period than most will think possible — just as they fell further and for longer than anyone thought possible. When that happens, housing will become less affordable as the cost of borrowing rises. But we are not there yet, and I don’t expect it to happen while the current administration is in office. The hope is that incomes will increase at a rate high enough to offset the increase in mortgage costs.
The Charts
Below are a few charts that we watch here at ReisNYC with the intensity of an eagle looking for a squirrel.
Supply (Inventory)
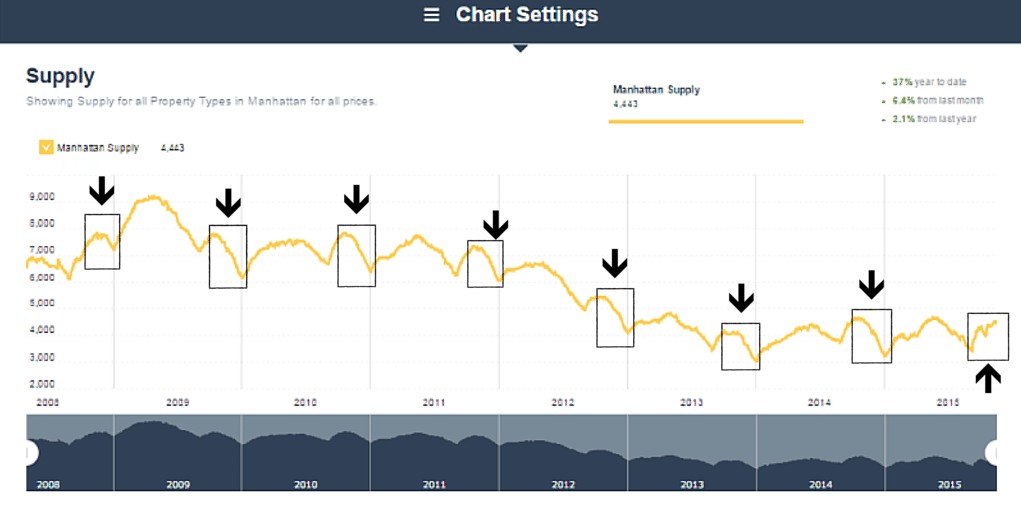
The first is “Supply,” also known as “Inventory” — simply the number of listings currently available in Manhattan, depicted over the last 8 years. The sections boxed in represent October, November, and December of each year. As you look left to right, you can see the number of listings drops dramatically in the final quarter of each year — except this year. We are in late November and supply is still increasing. Typically supply peaks in early October. But that is only half the story, as demand always plays into the picture.
Manhattan Supply 2008–2015 | Source: UrbanDigs
Pending Sales (Demand)
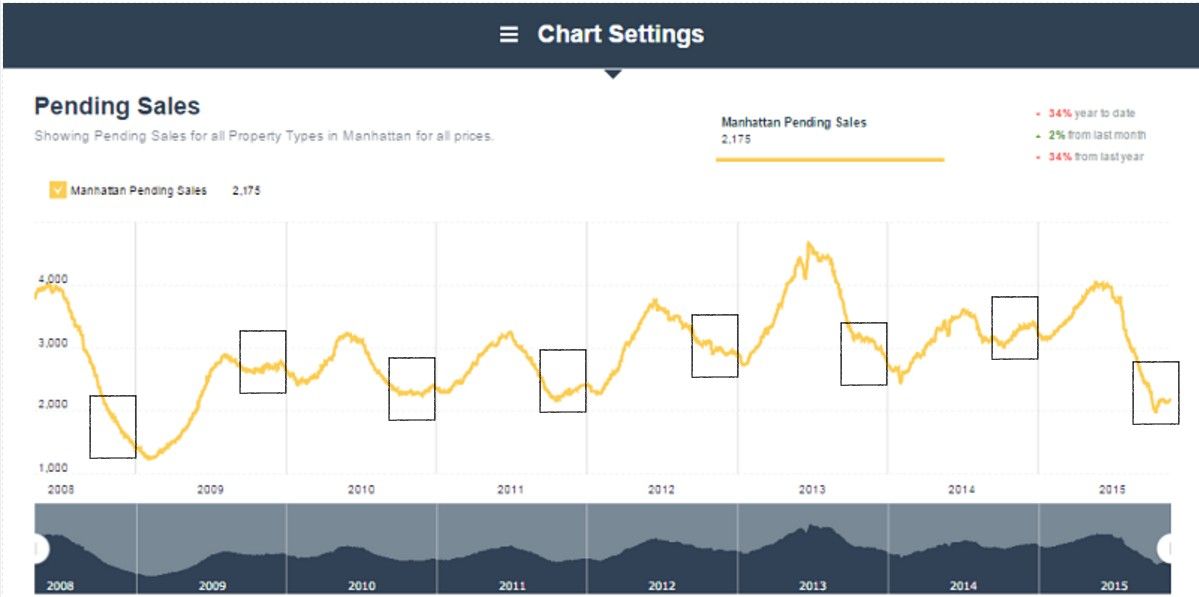
The second chart focuses on “Pending Sales,” also known as “Demand” — the number of units in contract. As you can see, demand typically falls off or goes flat during October, November, and December. This year is not much different, though the drop from the May peak is steep. Not a lot to glean here, as there are no glaring anomalies.
Manhattan Pending Sales 2008–2015 | Source: UrbanDigs
The Volatility Index
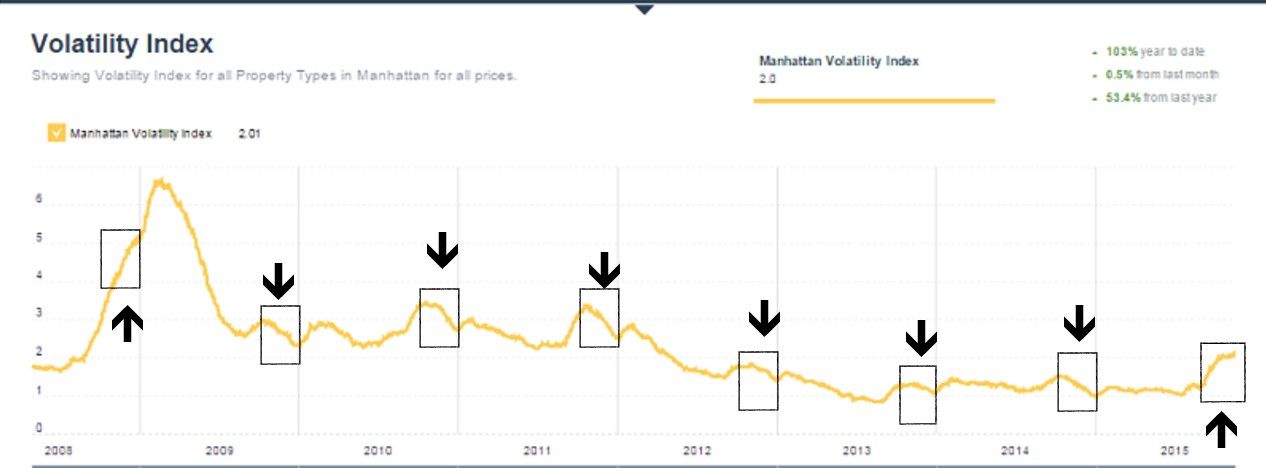
Now it starts to get interesting. The “Volatility Index” combines the previous two charts and expresses the data as a ratio — active listings versus units in contract. A ratio of 2.0 means there are twice as many properties for sale as there are in contract. The higher the ratio, the more selling pressure there is. The ratio had been under 2.0 for the last 3½ years — until this month, when we popped above it. In 2010 and 2011 it reached +3.0, and during the financial crisis it reached an astounding 6.66 on 2/19/2009. (For numerology fans: the S&P 500 bottomed on 3/9/2009 at 666.79 — a pretty amazing coincidence.)
Manhattan Volatility Index 2008–2015 | Source: UrbanDigs
StreetEasy Price Index vs. Volatility Index
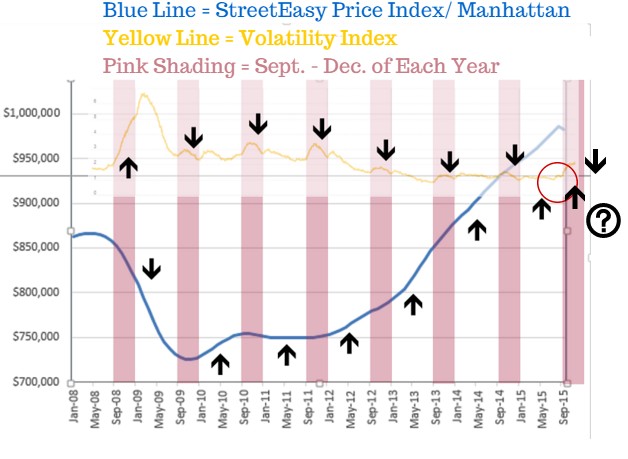
Lastly, we overlay all this data against Manhattan price action to look for correlation. To understand the implications, you have to understand seasonality. The last quarter of the year typically sees shrinking demand as buyers concentrate on the holidays — but the shrinking in supply is usually even more dramatic, as sellers wish to wait until after the New Year so their listing appears “fresh.” The arrows within the pink shading show the Volatility Index at year-end going back to 2008; the white arrows point to prices in the following year’s first three quarters.
Does the Volatility Index predict price trends? The sample size is small, but the correlation is strong. In 2008, the index shot to 6.66 — over the next 10 months, prices fell dramatically before bottoming in Q4. Over the next 6 years, each Q4 brought drops in the Volatility Index, and in 5 of those 6 years, markets were strong in the following year’s first three quarters.
Now take a look at the jump on the right edge of the chart (circled in red). The index has leaped from a July low of 0.99 to a high of 2.08 — a jump of 1.09 points, or 110%. In 2011 and 2012 the index jumped 1.11 and 1.13 points respectively, but those were 50% increases, not 110%. We still have 6 weeks to go until year-end. It bears watching… closely.
StreetEasy Price Index / Manhattan vs. Volatility Index (UrbanDigs) — 2008–2015
So… What To Do Now?
For most of us — nothing. Your home is your home. Prices will increase and decline throughout your ownership period, and the increases will last longer and move further than the declines. Population increases and land doesn’t. The ever-increasing urbanization of our society dictates that prices will continue to rise, with occasional selloffs.
However, if you have a reason to sell — if you’ve been holding off, retiring, moving to a warmer climate, or downsizing after the children have moved on — this IS important for you. Your window to act without significant competition is closing. Those interested in selling are already lining up, at a time when sellers usually are content to wait. Next year, the choices available to buyers will be far more varied, with brand-new product and an awful lot of it.
Your best path to getting in front of the coming wave is to prepare now. Find a strong, competent agent. Spend the next few weeks prepping your property: high-end photography, top-notch floorplans, staging — real or virtual. If you have clutter, consider renting storage for a few months. A small cost that is well worth it.
Get your apartment on the market before mid-January — the sooner the better. Properties do sell in December, as some buyers have no choice but to move quickly.
Ready to talk strategy? The ReisNYC Team is here to help — whether you want us to handle the sale or simply get expert, professional advice on timing and pricing.
Randy Reis | randy.reis@reisnyc.com | (917) 336-1118 | reisnyc.com
Randy Reis is a licensed real estate salesperson in New York City specializing in Manhattan residential sales and investor strategy.